How well do you know your favorite artist? Do you think you can name every one of their songs, let alone the albums? Have you ever wondered what it’s like to be in their shoes, touring the world, and ultimately ending up on the big stage in New York?
Here we take you on a journey alongside your favorite band, learning anything from how many songs they’ve released to where their last tour has been. Keep scrolling to learn more!
This project is brought to you by Enol Vallina and Evan Hahn. The inspiration and inception came to us as we were discussing our favorite artists and how we’d seen one of our favorite bands on separate continents only weeks apart. In addition to discussing our which songs and albums we liked most, we decided to look up ways of tracking the tours and couldn’t find any means of doing so. Thus began our exploration of bands’ gigographies and discographies. Utilizing Songkick’s and Musikki’s APIs we are able to dynamically search for any artist (as long as the data is present) to find information about the band history, members, songs performed, concert venues, and more.
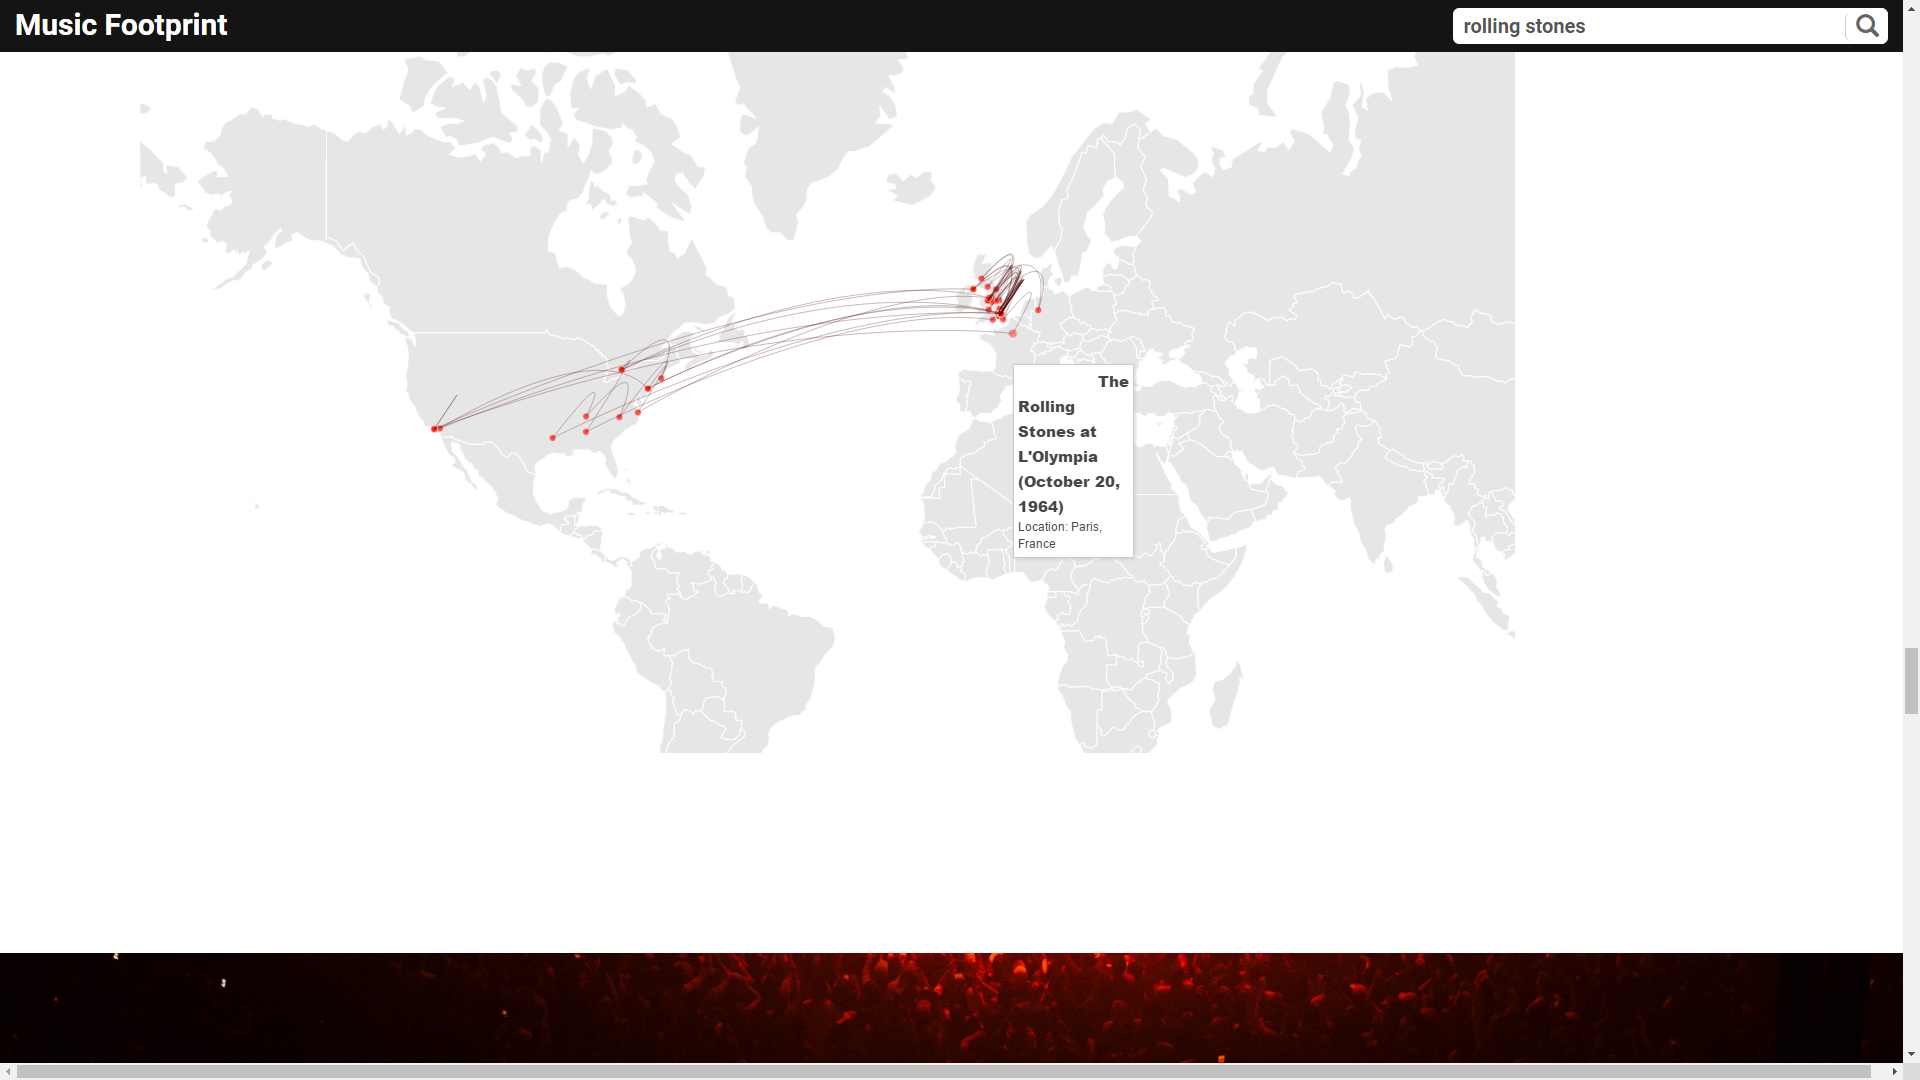
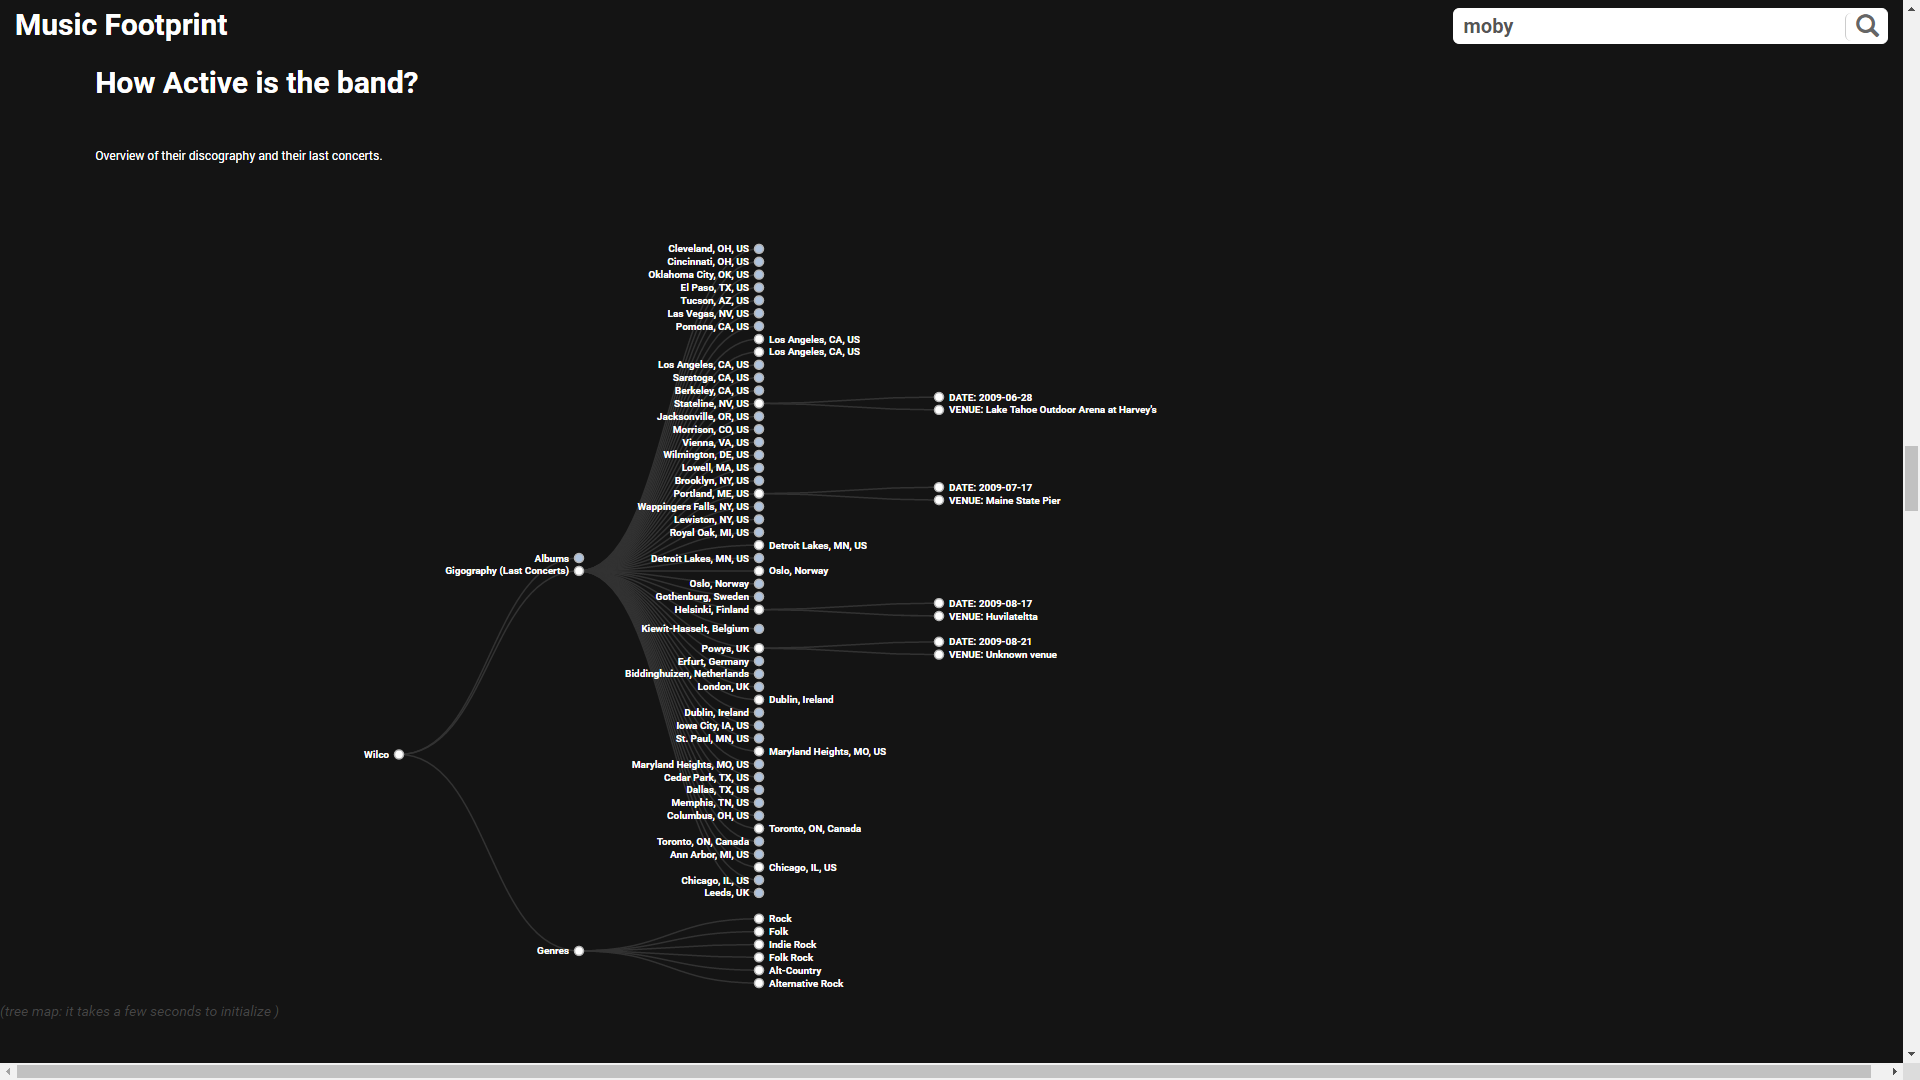
We chose to display this information for each band with a dynamically created visualization badge, a tree with more in depth gigography, albums, and genre, and a map of previous performances to see how they traveled the world. We
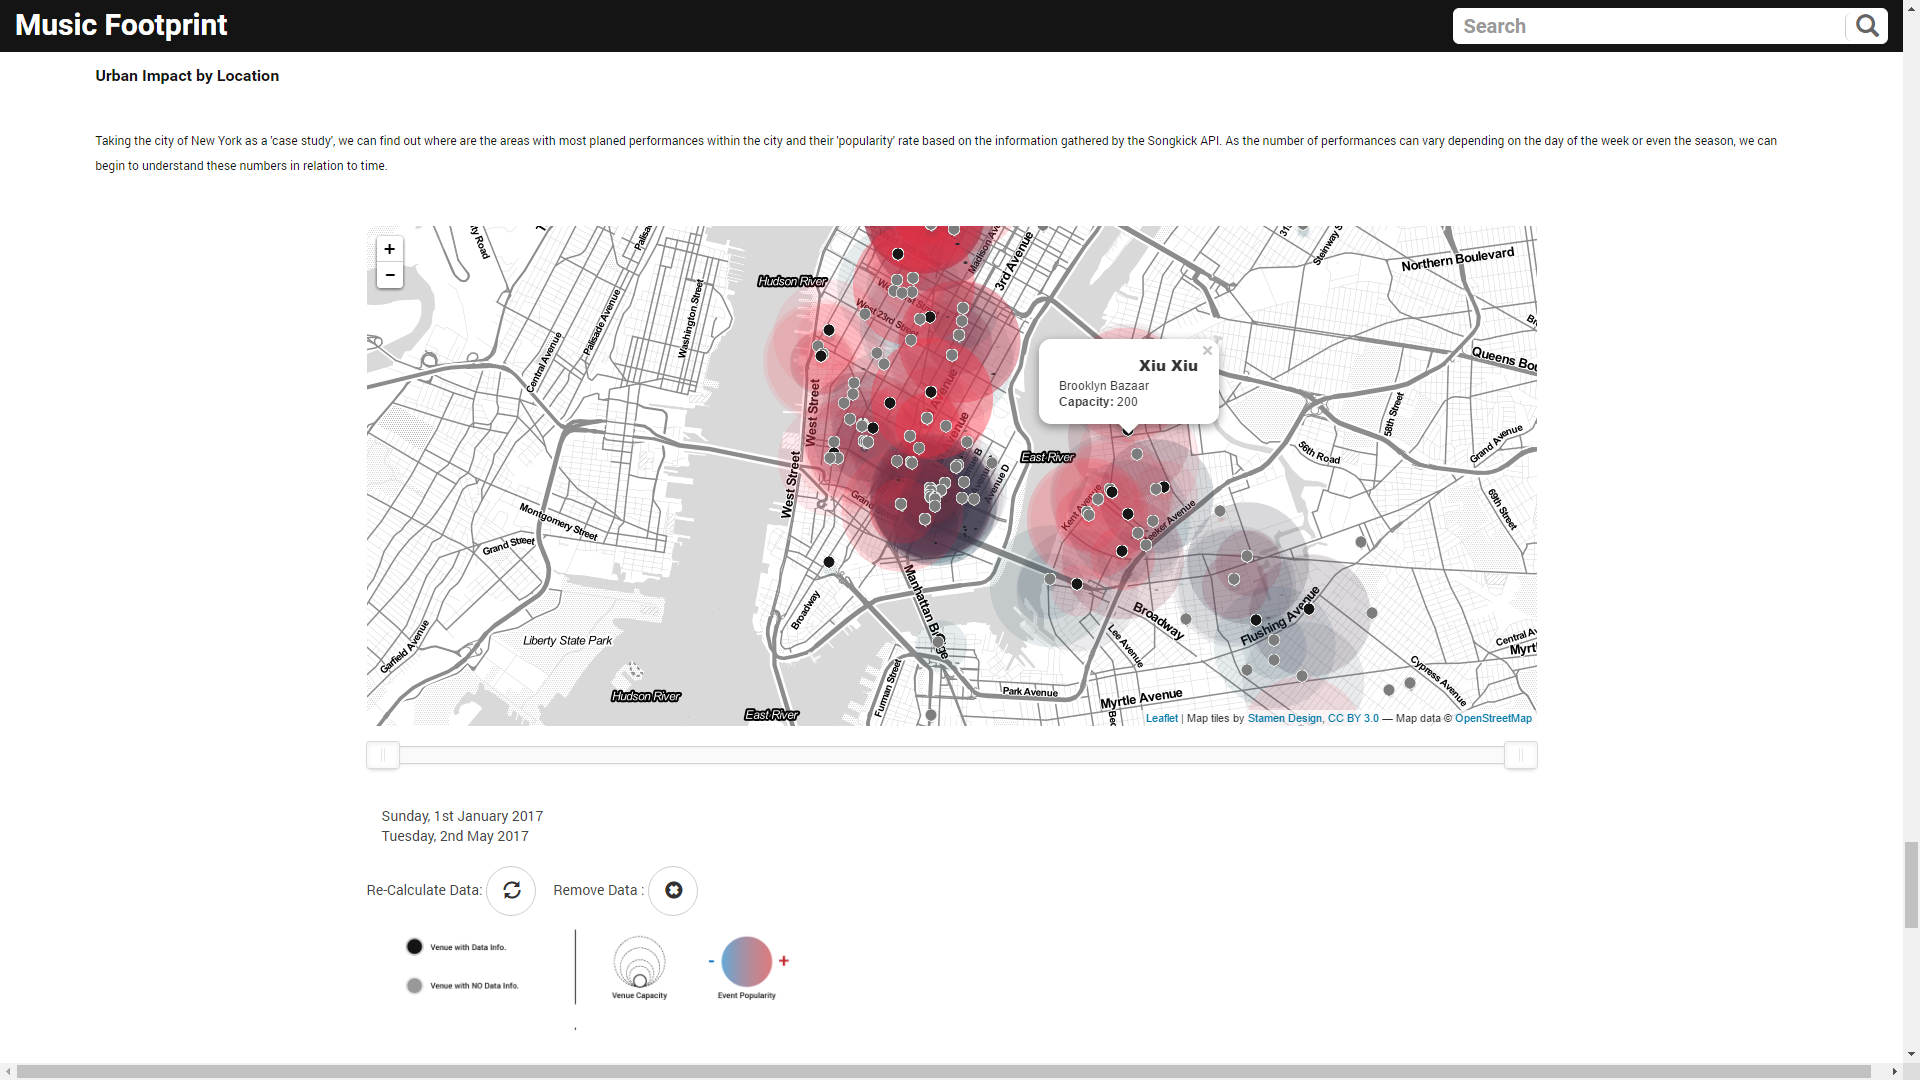
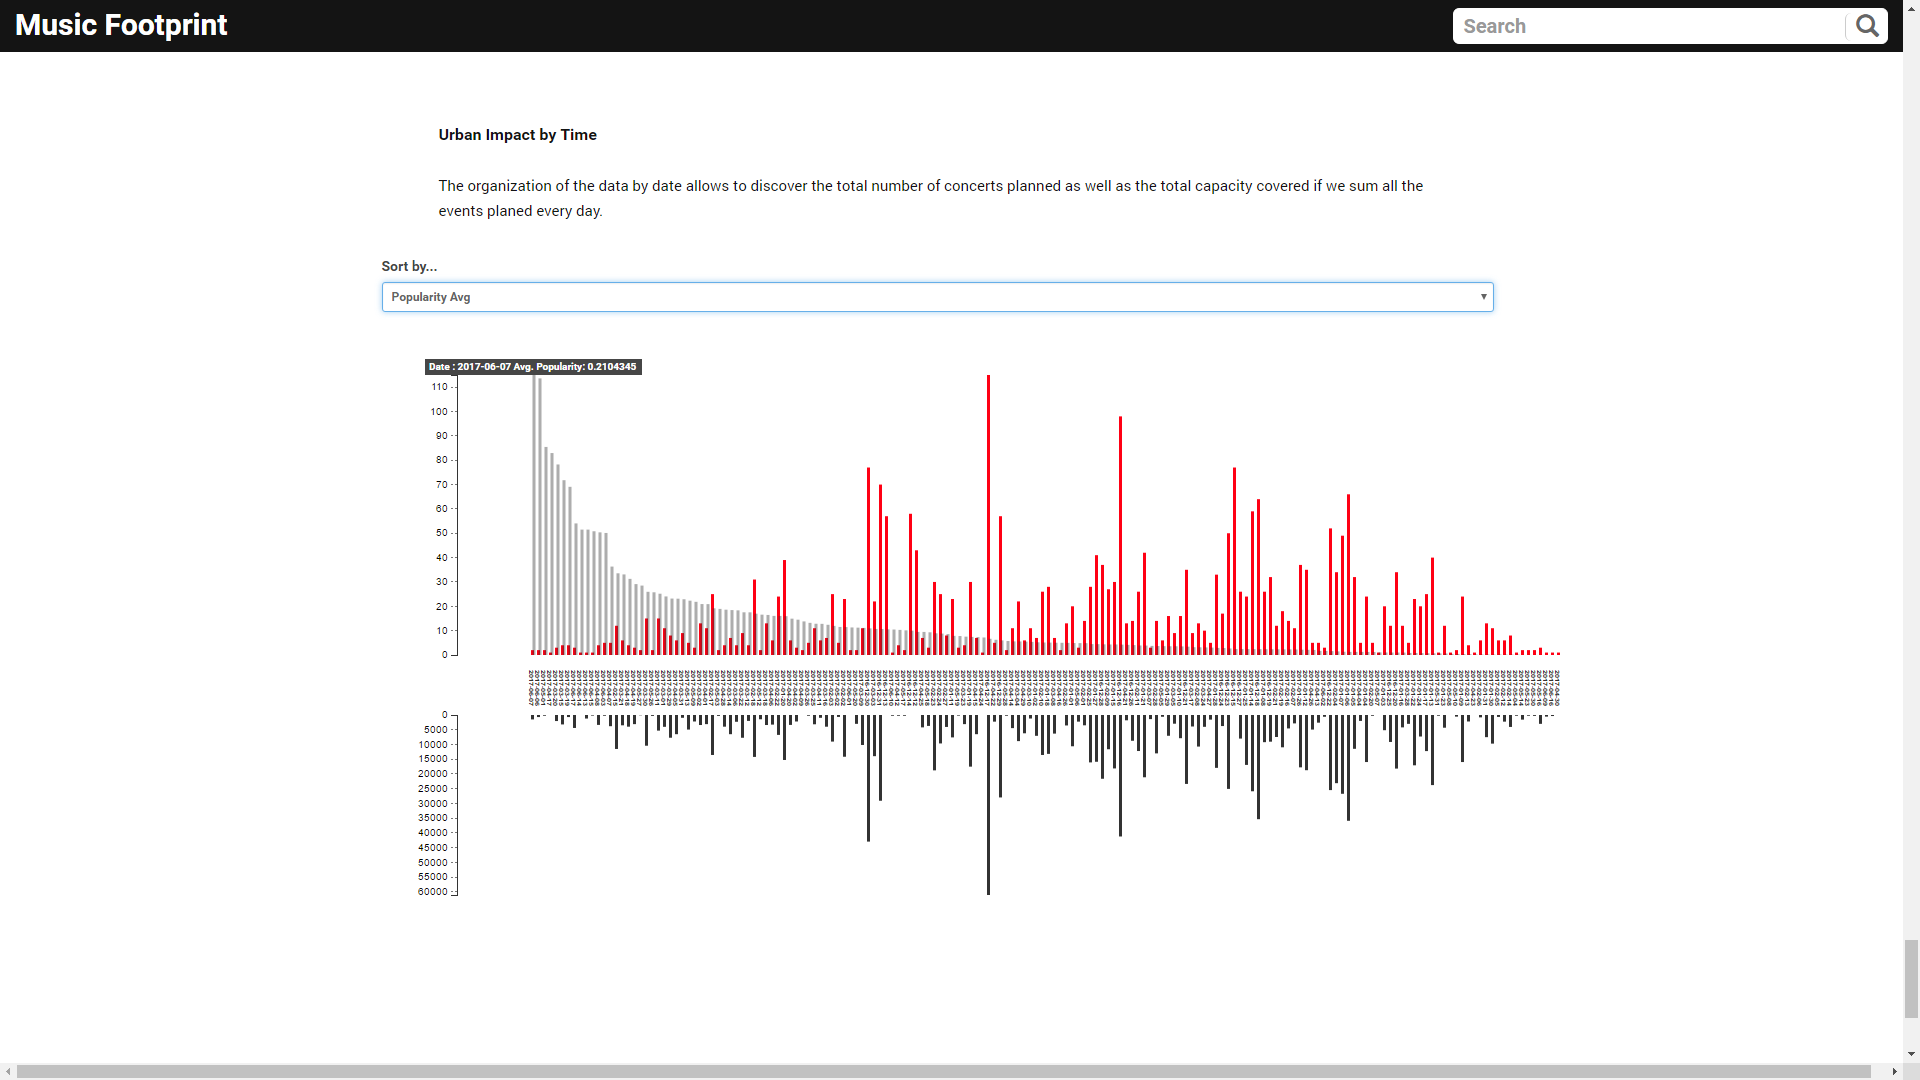
also decided to focus on New York City as a main hub for performances, taking a closer look at the venues and their capacities where many of these artists have performed
- Date: 2016
- Context: Harvard Graduate School of Design / 'CS171 - Data Visualization' Course
- Category: Data Visualization